Sometimes data is
complicated
we make it
easy as pie
Welcome to Pioneer Valley Data
inspiring dialogue, strategy, and measurement across the region
A one-stop shop for accessible, customizable information that provides the public, nonprofits, municipalities, and charitable foundations with a user-friendly tool to examine and assess a wide range of regional metrics.
Community News

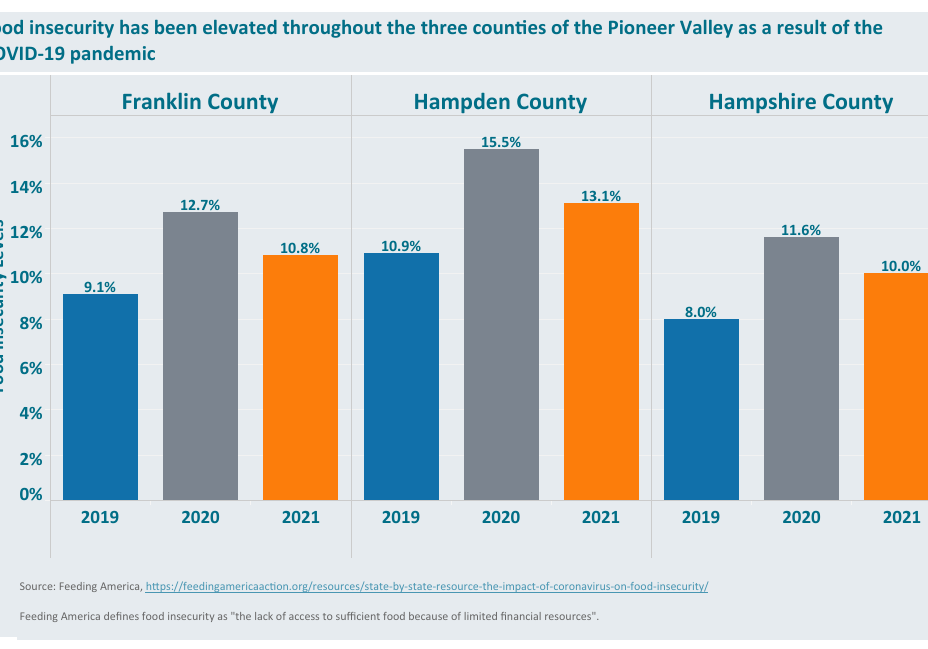
COVID Recovery Dashboard, “Safety Net, Food, and Hunger in the Pioneer Valley” Highlights Persistence of Food Insecurity
Pioneer Valley Data’s second COVID Recovery Dashboard, “Safety Net, Food, & Hunger in the Pioneer Valley”, highlights disturbing increases in food insecurity throughout the Pioneer Valley during the COVID-19 pandemic. Following the surge in unemployment documented in our first COVID recovery dashboard, “How has the COVID-19 Pandemic Impacted Workers in the Pioneer Valley?”, thousands of…

Black and Hispanic/Latino Workers Hit Disproportionately by the COVID-19 Shutdown of the Economy
Labor Day has come and gone, an occasion marked by some of us by enjoying a day off work, while for many others (mostly the same “essential workers” who have continued to step up during the entire “Pandemic Pause”), it was another day of work facing increased risk of infection, often at wages inadequate to…

Community Resilience in the Pioneer Valley
The U.S. Census Bureau recently released a new set of community resilience indicators, which measure “the capacity of individuals and households to absorb, endure, and recover from the health, social, and economic impacts of a disaster such as a hurricane or pandemic.” Just as COVID-19 has hit some of our communities harder than others, the…
Pioneer Valley Data Access
Raw Data Download
Query the exact data you’re looking for using our searchable database. Download the information you need to an Excel spreadsheet. Not everyone has a black belt in Microsoft Excel, but if you have SUM skills, you can simply download the raw data you are looking for and have at it.
GO
View by Topic
Looking for statistics and data regarding a particular issue? Our Topic Dashboards allow you to compare data points across municipalities, counties, and the region using interactive data visualizations. These dashboards can be customized, downloaded, and even embedded into your own site
Go


